by Mark R. Colberg, Ph.D.
Materials and Chemistry Laboratory, Inc. (MCLinc) provides routine analytical services as well as investigative services. Some recent investigations involved characterization of TENORM (Technologically Enhanced Naturally Occurring Radioactive Materials) encountered as fill materials within a metropolitan area. Radioactive materials are a cause of concern if found in a populated area, so these materials attract the interest of state and federal regulatory agencies. Since the origin of TENORM may be unknown, it may be necessary to fully characterize the materials in order to identify a source.
Projects of this type are basically forensics investigations which ask two basic questions: what is it, and where did it come from? MCLinc houses a number of tools used to characterize unknown materials, including optical microscopy, scanning electron microscope, x-ray spectroscopy, and x-ray diffraction. With a license to handle radioactive materials as well as a pool of knowledgeable staff, MCLinc is in a unique position to characterize NORM (naturally occurring radioactive materials) such as uranium ores or other radioactive solids), TENORM including mine wastes, slags, and heavy mineral sands. This article presents a case study describing a recent project involving TENORM, illustrating an array of tools used to characterize such materials.
A client encountered radioactive slags used as fill material. MCLinc was asked to characterize the slags in the hope that a likely source could be identified. Slags are the rocky byproduct of metals extraction by smelting ore in a furnace or blast furnace. Slags contain unwanted gangue components that were originally part of the ore, as well as parts of additives used to enhance melting and metal extraction. Depending on the original ore, smelting can concentrate radioactive components such as uranium or thorium. This being the case, radioactive slags can be classified as TENORM.
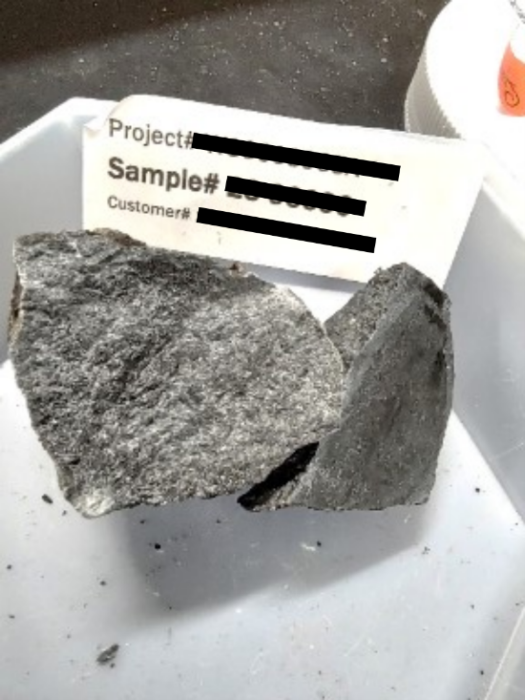
Samples of different types were submitted to MCLinc for analysis. The majority (three out of five) of the samples had a coarse-grained, granular (stoney) appearance, i.e. they looked like normal rocks (Figure 1). However, these ‘rocks’ have activities ranging to 14 µRem/hour, a level of radioactivity that is not large, but is higher than background activities. Long-term exposure even to low-activity TENORM materials is of concern, as are potential gaseous daughter products (e.g. Radon) that may be produced.
In characterizing these slags, a number of factors are important, including:
- What is the bulk chemistry of the slag,
- What minerals are present,
- What are the textural relationships between different minerals,
- What are the mineral compositions,
- What radioactive elements are present,
- What minerals are the radioactive elements associated with,
- Can this information be used to determine the source of the slags.
MCLinc offers several investigative tools to answer these questions, including polarized light microscopy (PLM), scanning electron microscopy (SEM) with energy dispersive x-ray spectroscopy (EDS or EDXS), and x-ray diffraction (XRD).
- SEM/EDS was used to visualize minerals, to qualitatively determine bulk compositions, determine elemental compositions of minerals, map mineral compositions, determine elemental associations and aid in mineral identification.
- XRD was used to identify individual minerals.
- PLM was used to visualize mineral textures and to aid in mineral identification.
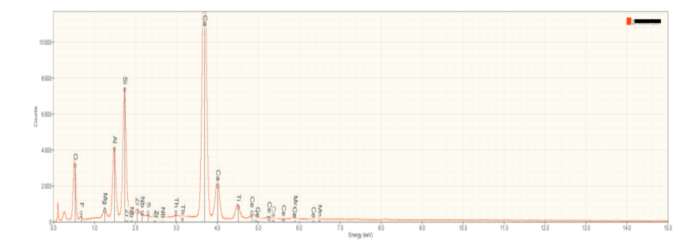
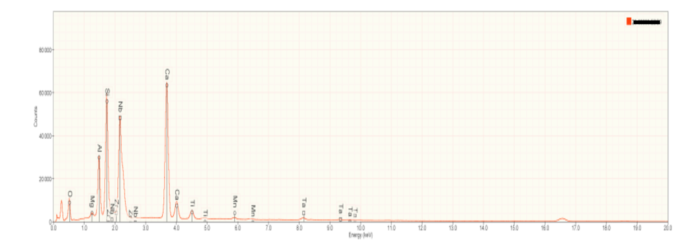
Bulk Composition SEM/EDS: Fragments of three slag samples were powdered for bulk elemental analysis using SEM/EDS, as well as mineral identification by XRD. A representative x-ray (EDXS) spectrum of a powdered slag is shown in Figure 2. Calcium (Ca), aluminum (Al), silicon (Si) and oxygen (O) were identified as major elements. As shown below, these elements define the primary minerals present in the slag. Note the presence of rare earth elements (niobium and cerium), and radioactive thorium as trace elements. Calculated oxide compositions for the three slag samples characterized for this investigation are contained in Table 1 near the end of this article, where they are compared to the chemical and mineralogical compositions of other reported slags.
| Major elements | Calcium, Aluminum, Silicon, Titanium, Oxygen |
| Minor elements | Manganese, Magnesium, Zirconium, Niobium, Cerium, Thorium |
X-ray Diffraction (XRD): An x-ray diffraction pattern and the results of a phase analysis for a representative slag is shown in Figure 3. Peaks in the x-ray diffraction pattern result from the ‘reflection’ of x-rays from crystallographic plane in minerals. Each mineral, or any crystalline solid, will provide a unique set of reflections depending on elemental composition (determined using EDXS) and the arrangement of atoms in a crystalline structure. In short, the x-ray diffraction pattern can be thought of as a unique ‘fingerprint’ for a mineral. Specialized software and databases are used to decipher x-ray diffraction data and assign diffraction peaks to minerals.
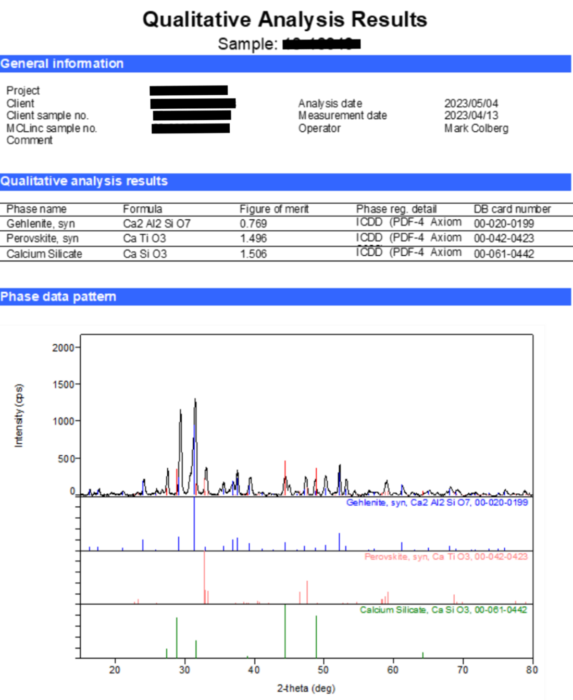
This procedure identified three primary minerals in the representative slag:
- Gehlenite (Ca2Al2SiO7),
- Calcium silicate (CaSiO3, analogous to the mineral wollastonite),
- Perovskite (CaTiO3).
These three minerals account for all of the major elements identified using XRD. The mineralogy of these slags is summarized in Table 1 where they are compared to the mineralogy of other slag types.
Polarized Light Microscopy (PLM): Thin sections were prepared for examination of the slag using PLM. PLM requires that a sample be thin enough to transmit light. Thin sections are made by mounting a flattened piece of the slag on a glass slide, followed by sawing, and grinding the section to a standard thickness of 0.03 mm. The final grinding steps are performed by hand. The sections are then given a final polish. The completed thin sections are used for examination by both PLM and SEM. The sections are coated with a thin layer of conductive carbon for examination in the SEM.
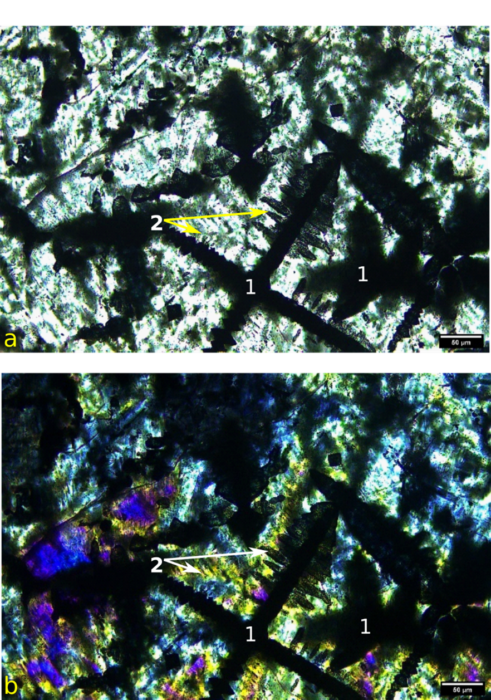
Representative PLM images of the slag are shown in Figure 4. The three minerals identified using XRD can be seen. Perovskite (labeled 1 in Figure 4) occurs as prominent spindly opaque grains, often intersecting at right angles. Calcium silicate (wollastonite?) occurs as greenish high relief spikes growing 90 degrees from the perovskite, and as arborescent (tree-like) growths in the matrix (2 in Figure 4). Gehlenite comprised most of the remainder of the slag and can be seen as colorless, low relief material in Figure 4a). Gehlenite shows yellowish to blue interference colors under crossed polarizers (Figure 4b).
PLM imaging reveals valuable textural information, that is information about mineral growth and how different minerals relate to one another. For instance, perovskite forms perfect often intersecting crystals, and are coated with spikes of calcium-silicate. This indicates that perovskite crystallized first, followed by calcium silicate. Calcium silicate is also present as arborescent growths in the matrix. Mist of the matrix is composed of gehlenite. So, the crystallization sequence for the slag appears to be perovskite – calcium silicate – gehlenite. The spindly nature of perovskite and arborescent calcium silicate are indicative of rapid crystallization from a melt as would be expected for a slag.
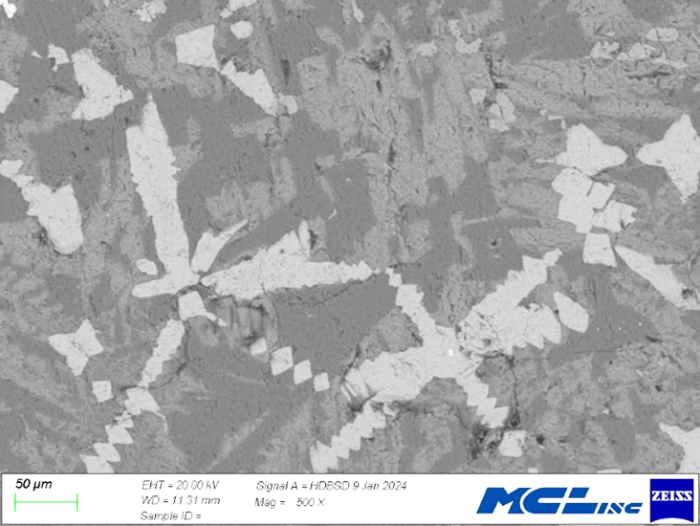
SEM/EDS: Representative SEM images are shown in Figure 5. Scanning electron microscopes typically provide two image types. Secondary electron (SE) images are formed from low energy electrons originating from the surface of a sample and image surface features of a sample. Backscattered electron images, as shown in Figure 5, are formed from higher energy electrons from deeper in the sample. The number of backscattered electrons ‘reflected’ from the sample depends on the average atomic weight of the sample, or part of a sample. Thus, materials with a greater average atomic weight appear brighter than materials with a lower average atonic weight. In the case of the slags, perovskite, which contains titanium, appears bright white in Figure 5. Gehlenite and calcium silicate appear dark grey and an intermediate grey in these mages. This shows the ability of BE imaging to differentiate between materials with different compositions.
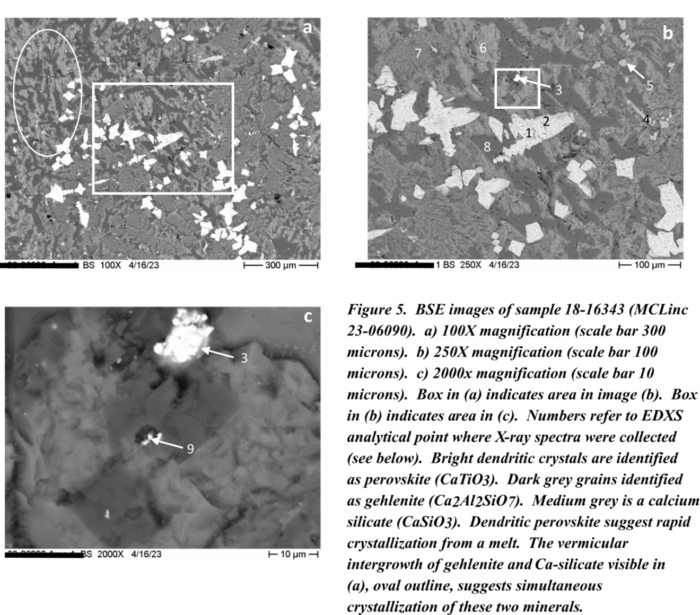
With BE imaging, materials with different compositions are easily differentiated. This helps with choosing grains for EDXS analysis as well as visualizing mineral textures that met not be seen using PLM. For instance, the circled area in Figure 5a shows a subtle ‘wormy’ or vermicular intergrowth of ca-silicate and gehlenite. Such textures typically form by simultaneous crystallization of two minerals.
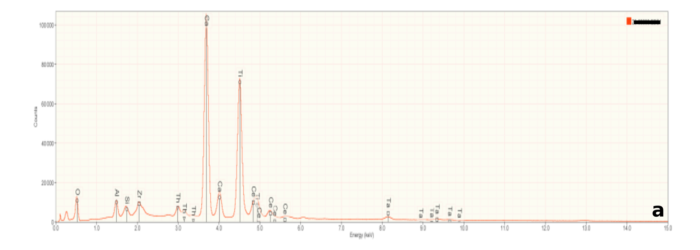
Besides imaging, a scanning electron microscope can provide chemical information when equipped with an energy dispersive x-ray spectrometer. Any material will emit x-rays when bombarded with high energy electrons but the wavelength (or energy) of emitted x-rays is unique to each elements. These are characteristic x-rays and serve as a fingerprint identifying specific elements. If an element is present, it will be represented by a specific peak on an x-ray spectrum. An energy Dispersive x-ray Detector measures a range of x-ray energies simultaneously, resulting in spectra like those in Figure 6.
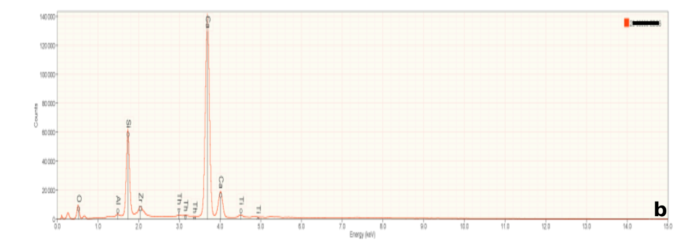
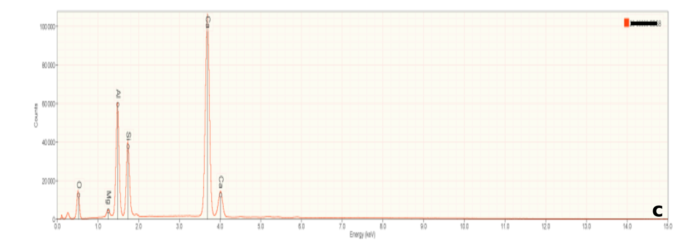
Figure 6a is representative of the perovskite (CaTiO3) in the slag samples. Calcium and titanium occur as major elements reflecting the elements that constitute this mineral. Numerous small peaks reflecting minor and trace elements are also present. Interestingly, these include tantalum (Ta), and the rare earth elements cerium (Ce) and thorium (Th). Thorium accounts for the radioactivity in the slags. Figures 6b and 6c are representative of calcium silicate and gehlenite, respectively. The major peaks Figures 6b and 6c mirror the elements present in these two minerals.
At high magnifications, scattered particles that appear very bright using BE imaging can be seen (Figure 5c). These particles display a large peak for niobium (Nb) as well as the elements seen in gehlenite. This suggests that the bright particles are metallic niobium (Nb) embedded in gehlenite.
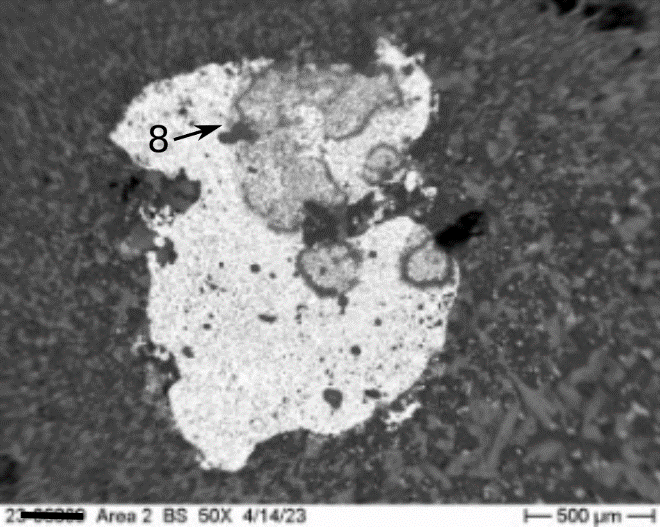
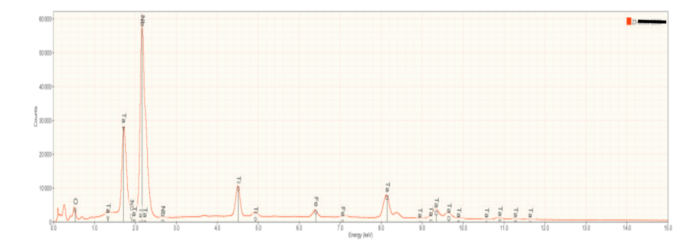
Occasionally, small but visible metallic bodies (or prills) were observed in the slag. An irregularly shaped metallic prill floating in a matrix of calcium silicate and gehlenite is shown in Figure 8. Prills are most often a remnant of the metal being extracted during the slag producing process. In this case, prills are comprised of neodymium (Nd) and tantalum (Ta), with minor amounts of iron (Fe) and titanium (Ti) (Figure 9).
For some purposes, it is important to know where certain elements reside in a material. For instance, is a radioactive element associated with a certain mineral? Is the element adsorbed onto an iron oxide coating or onto clay? These associations can be important when designing remediation systems or when designing a process for resource extraction.
The EDXS spectrum for perovskite (Figure 6a) displays several small peaks for a variety of elements, including rare earth elements (REE). The peak for thorium suggests that radioactivity, associated with thorium decay, is associated with perovskite, an inference based on the analysis of a single point. Although reasonable, a more robust analysis will depend on multiple data points. A qualitative approach to this is compositional mapping (sometimes called electron dot mapping). Compositional mapping is an imaging technique where x-rays associated are captured on a pixel-by-pixel basis as a sample is scanned by an electron beam. Variations in elemental concentrations are displayed as variations in brightness (or contrast) in an image. Usually, color coded maps for individual elements are generated.
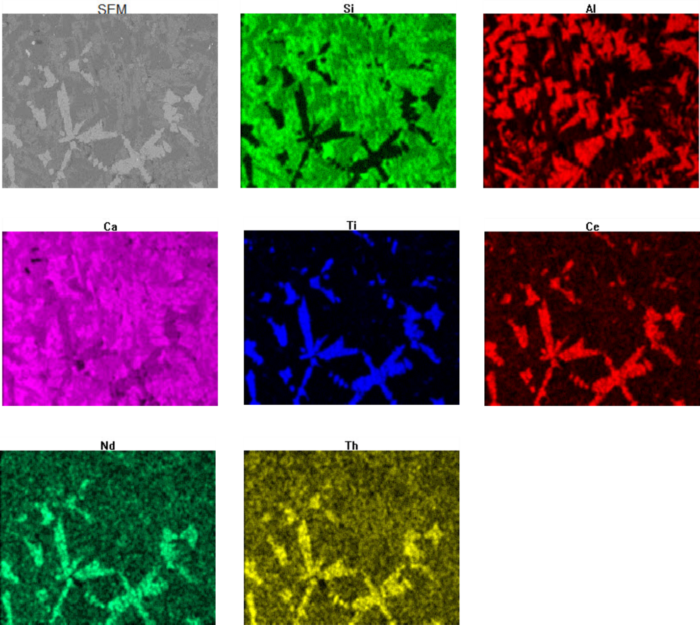
Figure 10 shows a BE image of a slag sample chosen (on the basis of visible textures) to demonstrate compositional mapping. Groups of perovskite are clearly visible (bright areas) as are calcium silicate (dark grey areas) and gehlenite (medium grey areas). Compositional maps for this area are contained in Figure 11.
The distribution of key elements in figure 10 clearly show how rare earth elements, including thorium, are associated with perovskite in the slags. Most of the constituent minerals are silicates and are easily visible in the Si elemental map. The bright green regions are calcium silicate. The darker green areas correlate to aluminum-rich regions in the Al compositional map and correspond to gehlenite. Perovskite, containing no silicon or aluminum are represented by the black patches in the Si map.
Perovskite is the only titanium-bearing phase in the slag and is clearly visible in the Ti compositional map. Examination of the Ce (cerium), Nd (neodymium), and Th (thorium) maps show a clear correlation between titanium and perovskite.
When compared to slags produced by other metallurgical processes (Table 1), clear differences can be seen between the MCLinc slags (Slags 1-3) and ferrous slags (Fe blast furnace and steel) and base-metal slags (Cu, Pb, and Zinc). Silica (SiO2) contents for all the slags are similar, but the slags analyzed for this investigation are richer in alumina (Al2O3) than are ferrous and base-metal slags. The three slags analyzed for this investigation are all very rich in CaO. The ferrous slags have similar high CaO concentrations, whereas the base-metal slags have much lower CaO contents. The three MCLinc slag samples are appreciably richer in TiO2 than ferrous and base-metal slags but contain less total iron (as FeO) than the ferrous and base-metal slags.
These difference in chemical composition has a profound impact on slag mineralogy. The three analyzed slags are distinguished by their Ca silicate and gehlenite content and accessory perovskite. Whilst ferrous and base-metal slags often contain gehlenite (or other melilite group minerals) Ca silicates and perovskite are rare. Fe-Mg silicates like olivine and pyroxenes are common in ferrous and base-metal slags as is spinel.
Table 1. Oxide compositions and phase identification for slags and background samples.
| Slag 1 | Slag 2 | Slag 3 | Fe1 Blast Furnace | Steel1 Blast Furnace | Cu1 Smelter | Pb1 Smelter | Zn1 Smelter | |
| Bulk Chemistry as Oxides (Wt. %) | ||||||||
| SiO2 | 26.1 | 26.7 | 24.9 | 34.2 | 21.1 | 11.3 | 29.4 | 23.1 |
| TiO2 | 4.3 | 3.9 | 6.3 | 0.7 | 0.6 | 0.3 | 0.4 | |
| Al2O3 | 13.2 | 12.7 | 12 | 12.5 | 5.3 | 8.1 | 4.2 | 10.2 |
| FeO | 0.5 | 0.5 | 0.4 | 2.6 | 19.6 | 29 | 26.3 | 32.6 |
| MgO | 1.7 | 1.4 | 2.1 | 8.2 | 6.3 | 2.1 | 1.5 | 1.81 |
| CaO | 48.4 | 49.3 | 47.9 | 36.9 | 32.9 | 9.8 | 9.5 | 18.55 |
| MnO | 0.4 | 0.5 | 0.5 | 0.8 | 4.9 | 0.5 | 3.1 | 1 |
| Na2O | 0.2 | 0.4 | 0.4 | |||||
| K2O | 0.7 | 0.3 | 2.3 | 1 | ||||
| ZrO2 | 2.1 | 2.6 | 2.4 | |||||
| CeO2 | 2 | 1.6 | 2.4 | |||||
| Nd2O3 | 0.3 | 0.3 | 0.4 | |||||
| ThO | 0.5 | 0.5 | 0.6 | |||||
| XRD Phases (major phases only) | ||||||||
| Gehlenite/Melilite gp | X | X | X | X | X | X | X | X |
| Perovskite | X | X | X | |||||
| Ca-Silicate | X | X | X | |||||
| Olivine gp. | X | X | X | X | X | |||
| Pyroxene | X | X | X | X | ||||
| Quartz | X | x | ||||||
| Feldspar | X | X | X | |||||
| Spinel | X | X | X | X | X | |||
| (Ca,Fe,Mg,Mn)Oxide | X | X | ||||||
| Metal (by element) | REE2 | REE2 | REE2 | Fe | Fe | Cu, Zn, Pb | Pb, Zn, Cu | Zn, Pb, Cu |
| Sulfides (by element) | Cu, Fe, Cu-Fe, Pb, Zn | Cu, Fe, Cu-Fe, Pb, Zn | Cu, Fe, Cu-Fe, Pb, Zn |
2 – REE= Rare Earth Elements
Origin of the slag.
The chemical and mineralogical compositions of the MCLinc slag is unusual and is very different from most metallurgical slags (Table 1). Slags are byproducts of extractive metallurgical processes most slags contain remnant bodies (prills) of the metal being produced. For instance, ferrous slags can contain iron or steel prills, while base-metal slags can contain copper, lead or zinc prills. The three MCLinc slags contain prills composed of tantalum and neodymium. The slags appear to be a byproduct of rare earth element (REE) extraction. However, the question remains as to the ultimate source of the material processed to form the slags.
Slags discussed in an NRC-NUREG document (NUREG-1703) are chemically and mineralogically similar to three analyzed slags. Some of the NRC slags contain dendritic perovskite, and gehlenite, but contain other phases as well. Like the three MCLinc slags, most radioactivity is attributed to elevated levels of thorium.
The NRC attributed the origin of the reported slags to reprocessing of tin slags for their rare earth content. Tin slags are produced through smelting cassiterite (SnO) bearing ore, often cassiterite-rich pegmatites. Tin pegmatites often have elevated levels of thorium and other rare earth elements concentrated in various accessory minerals such as Thorite (ThSiO4), Columbite (Mn,Fe)(Nb,Ta)2O6), Tantalite ((Mn,Fe)(Ta,Nb)2O6), Wodginite (Mn(Sn,Ta,Ti,Fe)(Ta,Nb)2O8), and many others. Rutile (TiO2) and Ilmenite (Fe,Mn)TiO3) are common titanium bearing minerals in pegmatite. Many of the primary minerals in pegmatites are aluminum-rich, such as albite (NaAlSi3O8), K-feldspar (KAlSi3O8), Muscovite (KAl2(AlSi3O10)(OH)2) and other micas, and other minerals.
Smelting is accomplished by heating the ore in the presence of carbon (usually coke) to produce a reducing environment. Limestone (nominally calcite, CaCO3) is usually added as a fluxing agent to aid in the production of slag. Given the high aluminum and the titanium and rare earth content of content of pegmatites, and the addition of Ca-rich limestone, smelting of a tin-rich pegmatite would result in an Al-Ti-REE-rich slag, that when smelted a second to remove rare earth elements could produce a slag with the characteristics seen tin the MCLinc slags and the slags reported in NUREG-1703.
REFERENCES
Piatak, N.M., Ettler, V., and Hoppe, D. (2021) Geochemistry and Mineralogy of Slags, in, Piatak, M.N., and Ettler, V., Metallurgical Slags: Environmental Geochemistry and Resource Potential, Royal Society of Chemistry, Cambridge, UK, pp. 59-124.
Veblen, L.A., Farthing, D., O’Donnell, E.O., and Randle, J.D. (2004), Characterization of Radioactive Slags, NUREG-1703, U.S. Nuclear Regulatory Commission, Washington D.C., 94p.